
Introduction
Android Studio, like any other complex software, can sometimes encounter issues that hinder performance. One of the most common and frustrating problems developers face is the java.lang.OutOfMemoryError. This error occurs when the application runs out of memory, causing it to crash or fail to compile. This article explores the causes of the OutOfMemoryError in Android Studio and provides detailed steps to fix it.
Understanding the OutOfMemoryError
The OutOfMemoryError is a critical issue that can arise in various contexts, including Android development. It happens when the application or the build process consumes more memory than is available. This can be due to several factors, including inefficient coding practices, large resource files, or misconfigured build settings.
Causes of OutOfMemoryError
-
Memory Leaks: Memory leaks occur when an application holds references to objects that are no longer needed. This prevents the garbage collector from releasing the memory, leading to a gradual increase in memory usage until it reaches a critical point where the
OutOfMemoryErroroccurs. -
Large Resource Files: Using large resource files such as high-resolution images or complex layouts can consume a significant amount of memory. If these resources are not properly optimized, they can cause the application to run out of memory.
-
Inefficient Coding Practices: Poor coding practices, such as not releasing resources like bitmaps or views, can also lead to memory leaks. Static views, contexts, or activities can hold onto memory until the application is closed, preventing the garbage collector from freeing up space.
-
Gradle Issues: Gradle is a build tool used in Android development to manage dependencies and build the project. However, it can sometimes consume all the heap memory during compilation, leading to an
OutOfMemoryError. This issue can be resolved by increasing the memory buffer in thegradle.propertiesfile or by clearing the build cache. -
Android Emulator: The Android emulator is known for its high RAM usage. Using the emulator can significantly increase the memory consumption of Android Studio, especially if you are running multiple emulators simultaneously.
Steps to Fix OutOfMemoryError
Increase Memory Buffer in gradle.properties
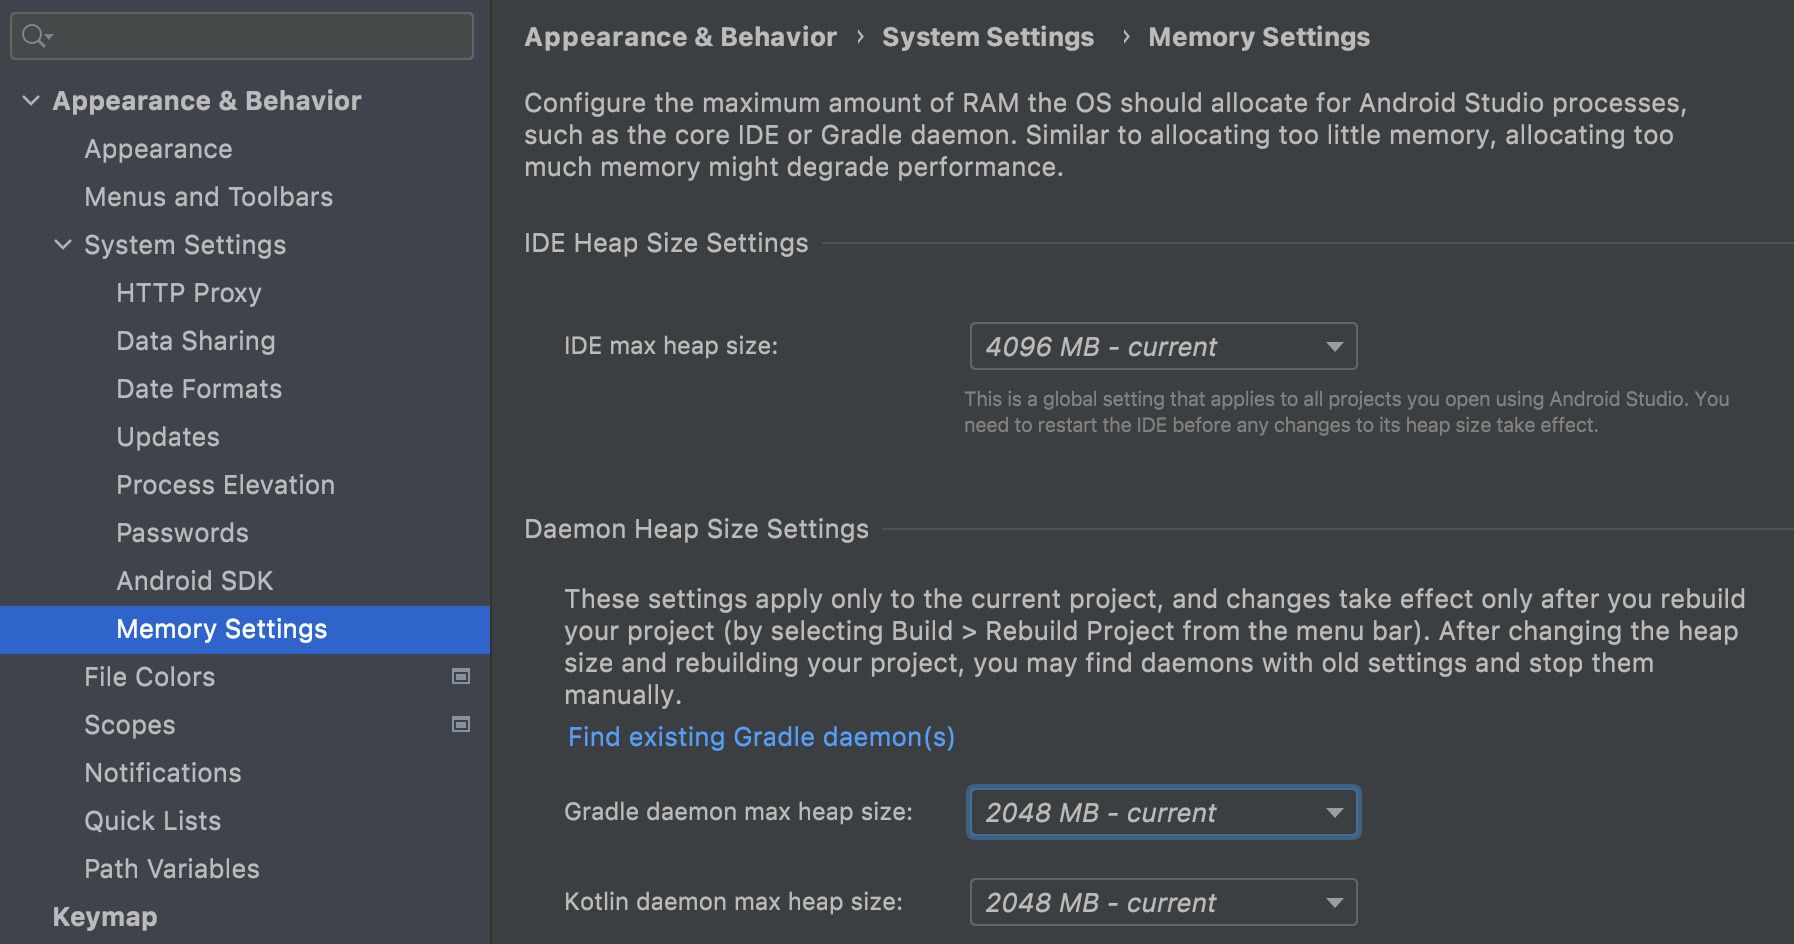
One of the simplest ways to fix the OutOfMemoryError is by increasing the memory buffer in the gradle.properties file. This file is located in the root of your project directory. You can add or modify the following line to increase the heap size:
plaintext
org.gradle.jvmargs=-Xmx4G
This sets the maximum heap size to 4GB. Adjust this value based on your system's available memory.
Clear Build Cache
Another effective method is to clear the build cache. This can be done using the following command in your terminal:
plaintext
./gradlew cleanBuildCache
This command will remove all the cached build data, which can help in resolving memory-related issues.
Optimize Resource Files
Optimizing resource files such as images and layouts can significantly reduce memory consumption. For example, using compressed images or reducing the complexity of layouts can help in preventing memory leaks.
Avoid Static Views and Contexts
Static views, contexts, or activities should be avoided as they hold onto memory until the application is closed. Instead, use non-static references to these objects to allow the garbage collector to release them when they are no longer needed.
Use Remote Gradle Cache
Using a remote Gradle cache can help in reducing local memory usage by storing build data on a remote server. However, ensure that your network connection is stable and fast to avoid network-related issues.
Check JDK Settings
Ensure that the JDK specified in Android Studio for running Gradle is the same as the one specified for JAVA_HOME. This ensures that Gradle daemons can reuse the same JVM instances, reducing memory consumption.
Avoid Multiple Gradle Daemons
Multiple instances of Gradle daemons can consume a significant amount of memory. Ensure that you are not running multiple instances of Gradle from both Android Studio and the terminal simultaneously.
Additional Tips
-
Use Memory Profiler: Android Studio's memory profiler can help in identifying the classes that cause memory leaks. This tool can be accessed by going to
Run > Profiling > Memory Profiler. -
Upgrade Gradle and Kotlin: Sometimes, issues with kapt (Kotlin annotation processor) can be resolved by upgrading to the latest stable version of Kotlin.
-
Reduce Emulator Usage: If possible, use alternative tools like Waydroid for emulation instead of the Android emulator to reduce memory consumption.
By following these steps and tips, developers can significantly reduce the occurrence of java.lang.OutOfMemoryError in Android Studio, ensuring a more efficient and productive development environment.